See how your agent is doing
See how many calls your agents handled, what came of them and how that changed.
Checked
Read the overview
In your dashboard, open More and choose Analytics.
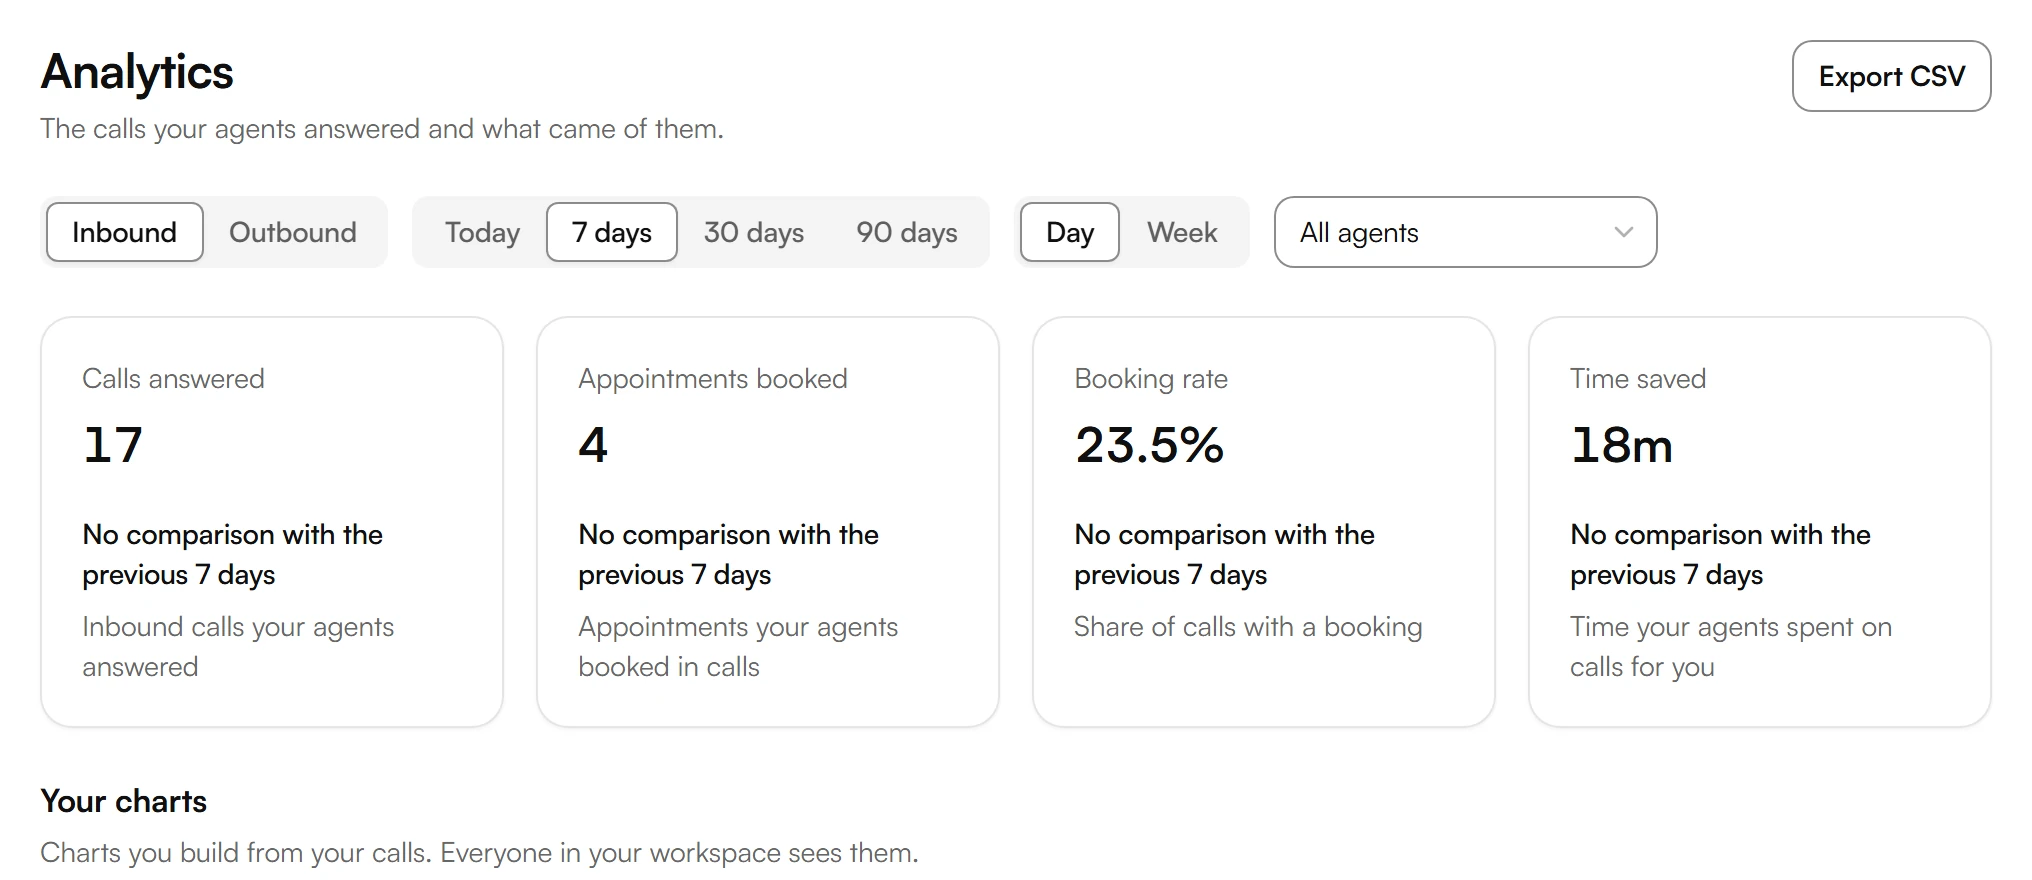
Choose Inbound or Outbound. Inbound shows Calls answered, Appointments booked, Booking rate and Time saved. Outbound shows Calls made, Pickup rate, Voicemail rate and Appointments booked.
Choose the period: Today, 7 days, 30 days or 90 days, and show the charts per Day or Week. To see one agent, change All agents.
Each tile compares the period with the one before. Below, you find charts of calls and bookings, outcomes, end reasons, the callers' mood and the topics callers raise.
Build your own charts
Under Your charts, choose Add chart to track what matters to you, such as booked appointments by agent or calls by hour of day. Everyone in your workspace sees them.
To download the numbers, choose Export CSV.
Was this helpful?
Related articles
Still have questions?
Write to us at support@kesru.com.